Designing an MVP for Smart Fleet Management
How user-centered design helped secure funding and demonstrate AI’s value in transforming fleet safety.
Project
Build MVP for Peregrine, a video telematics startup, to validate product vision and drive fleet manager adoption
Challenge
Make raw dashcam data useful, trustworthy, and insightful enough to justify installation
Strategy
Balanced short-term constraints with long-term vision, built trust with fleet managers and internal ML teams
Outcome
Delivered MVP that enabled faster incident analysis, supported AI training, and helped secure early funding
01
THE STARTUP BET
Turning raw data into a real product
Peregrine, a deep-tech startup in the video telematics space, set out to transform how fleet managers understand driver behavior and manage road incidents.
- A working dashcam prototype
- Basic computer vision
-
No usable product or UI

As the first and only designer, I was tasked with designing an MVP from the ground up. The product needed to deliver value to skeptical customers, collect structured data for AI training, and help secure the next round of funding.
-
Deliver immediate value to skeptical customers
-
Begin collecting structured data to support AI model training
-
Help secure the startup’s next round of funding
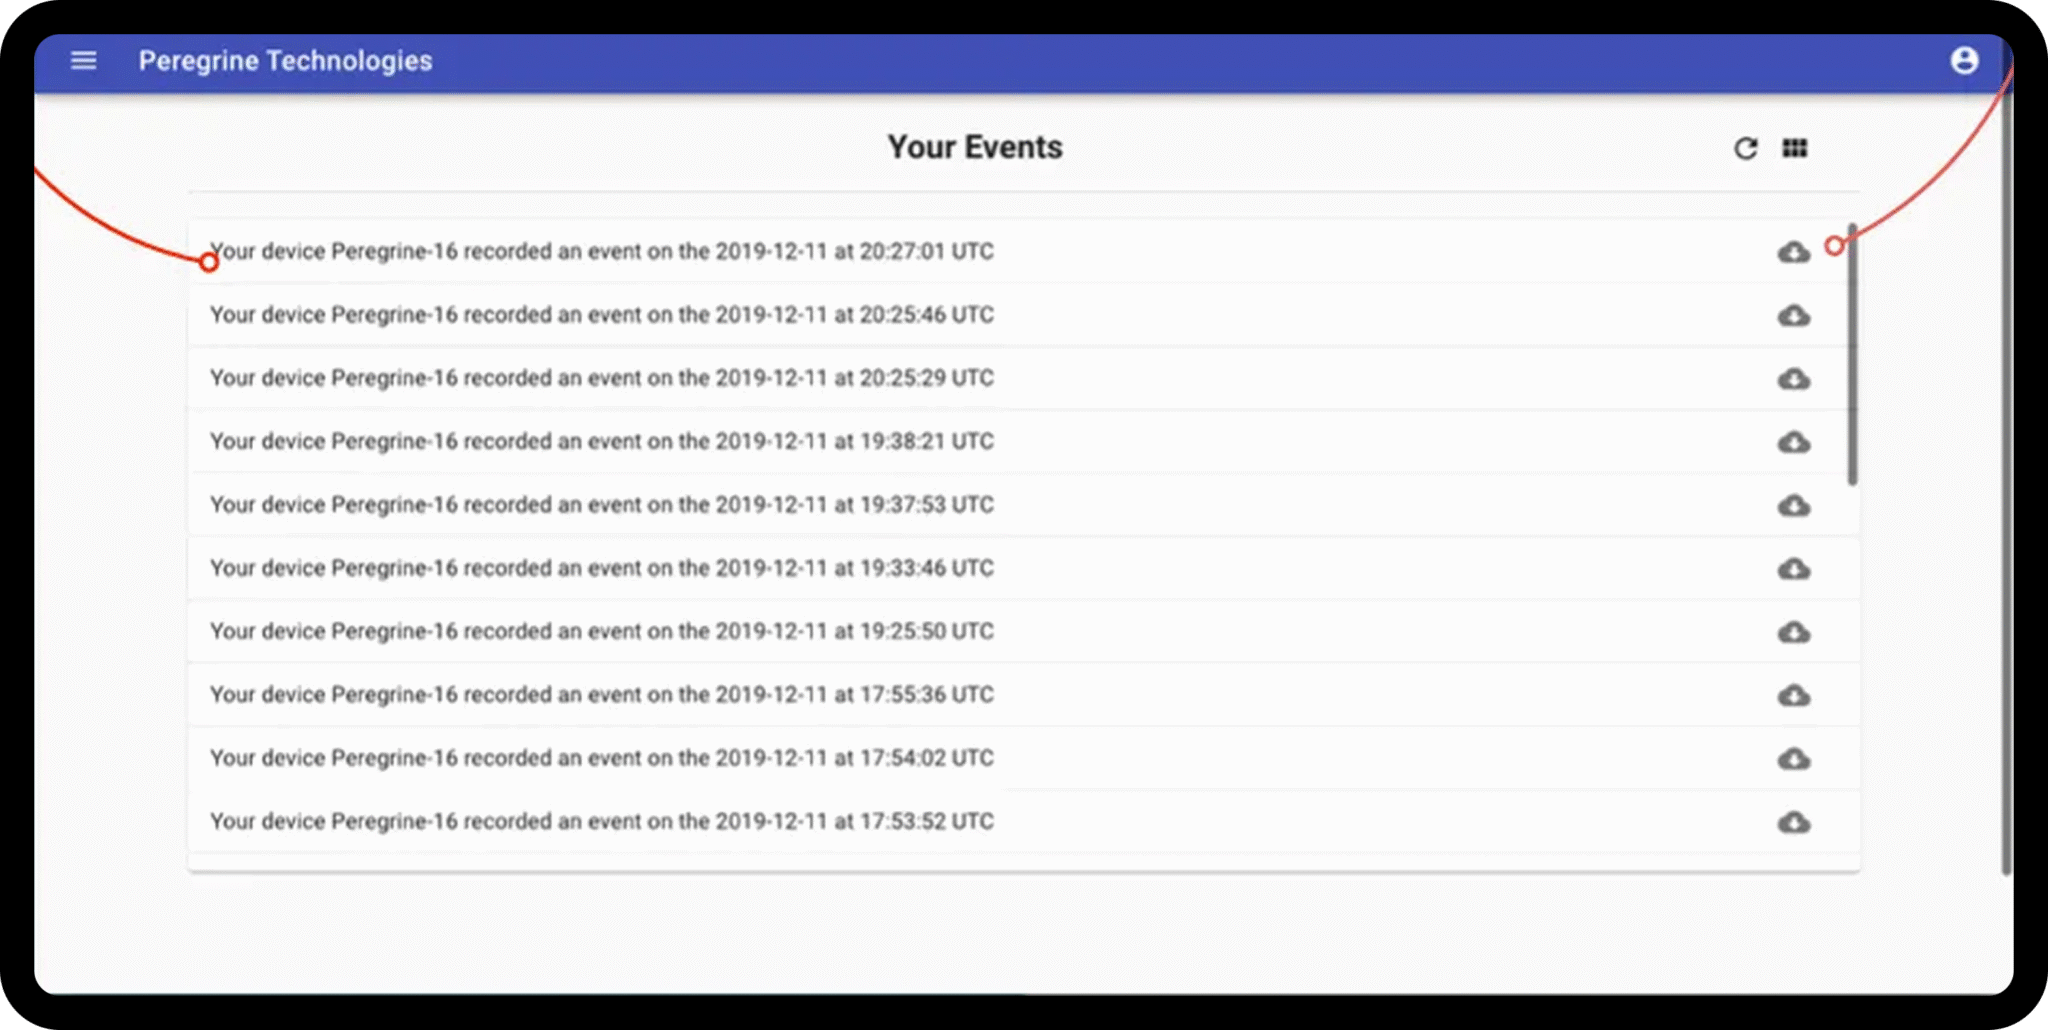
The starting point for the dashboard.
"How to effectively leverage existing technology to create a product that delivers significant value, gaining the trust of fleet managers and encouraging widespread adoption of our smart dash cam?"
02
USER INSIGHTS
User Intelligence: Finding the Right Leverage Point
Before diving into design, I needed to understand the landscape. Who were our users? What were their pain points? This included not only fleet managers but also our internal stakeholders – the data science and ML teams.
With limited resources, a pragmatic research approach was essential.
To maximize impact, my research approach included:
With limited resources, a pragmatic research approach was essential.
To maximize impact, my research approach included:
-
Competitor and desk research
-
Internal interviews with engineers and stakeholders
-
Pilot data from early test fleets
-
Strategic partnership with the Alexander von Humboldt Institute (HIIG)
Key Insight
-
Data Unreliability: Existing solutions struggled with data accuracy, leading to disputes and mistrust.
-
Lack of Context: Incidents were recorded, but the “why” remained a mystery, hindering effective driver training and safety improvements.
-
Data Overload: Fleet managers were drowning in data, struggling to extract actionable insights.
It became clear that the key to wider adoption was demonstrating clear and immediate value to fleet managers in exchange for their participation in data collection.
"While the MVP was built with multiple user groups in mind — including internal teams and drivers — this case study focuses on the fleet manager experience. Their perspective was key to shaping the product’s first version and proving its real-world value."
03
STRATEGIC FOCUS
Prove Value with One High-Leverage Workflow
Instead of spreading efforts thin across a full platform, I prioritized accident and event management as the core use case. Why?
It directly impacted customer ROI (faster reviews, better safety coaching).
It provided valuable labeled data to train AI models.
It made it easy to tell a clear product story to customers and investors.
It directly impacted customer ROI (faster reviews, better safety coaching).
It provided valuable labeled data to train AI models.
It made it easy to tell a clear product story to customers and investors.
- It directly impacted customer ROI (faster reviews, better safety coaching).
- It provided valuable labeled data to train AI models.
- It made it easy to tell a clear product story to customers and investors.
MVP Scope
- Events Library – Triage and prioritize incidents
-
Event Detail View – Understand root causes and driver behavior
04
EXPERIENCE DESIGN
From Raw Footage to Actionable Insight
Events Library – Control the Noise
This page was designed toprovide a clear and concise overview of all captured events. Robust filtering and sorting capabilities allowed fleet managers to quickly identify high-risk incidents, prioritize their attention, and reduce data overload. Visual cues and clear labeling further enhanced usability, making it easy to navigate and understand the information presented. This page provided immediate value by streamlining incident review and management.
Key Features
- Robust filters by event type, location, severity, etc.
- Visual hierarchy and color cues to reduce scanning time
-
Future-ready architecture (e.g., planned driver-level filtering vs device ID)
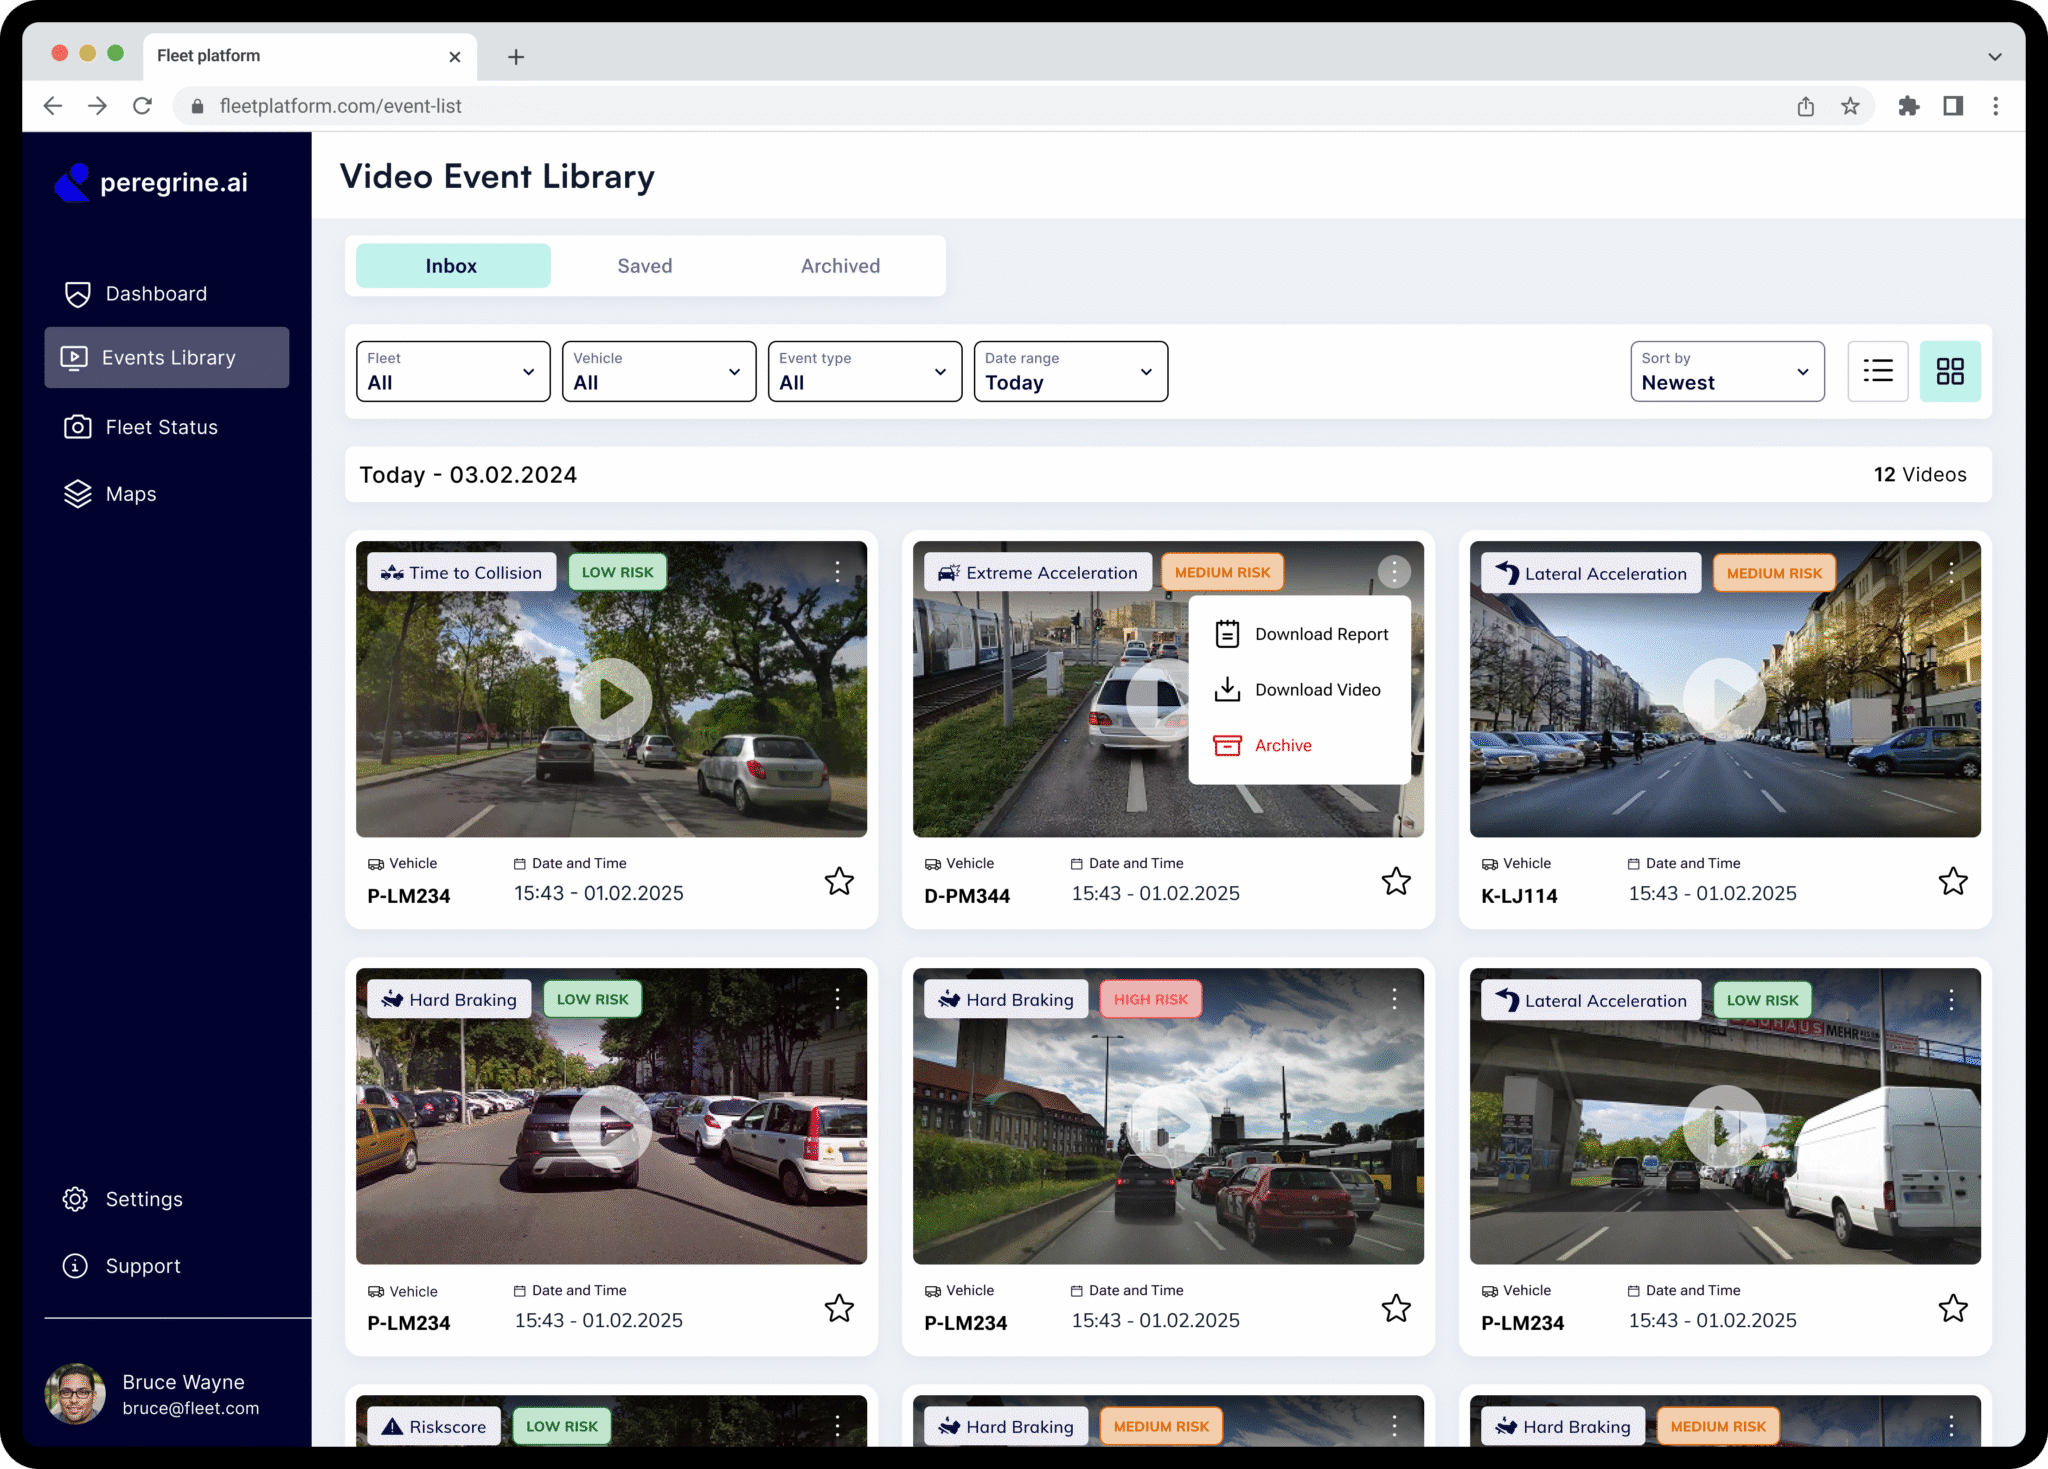
The interface for the Video Event Library in grid mode.
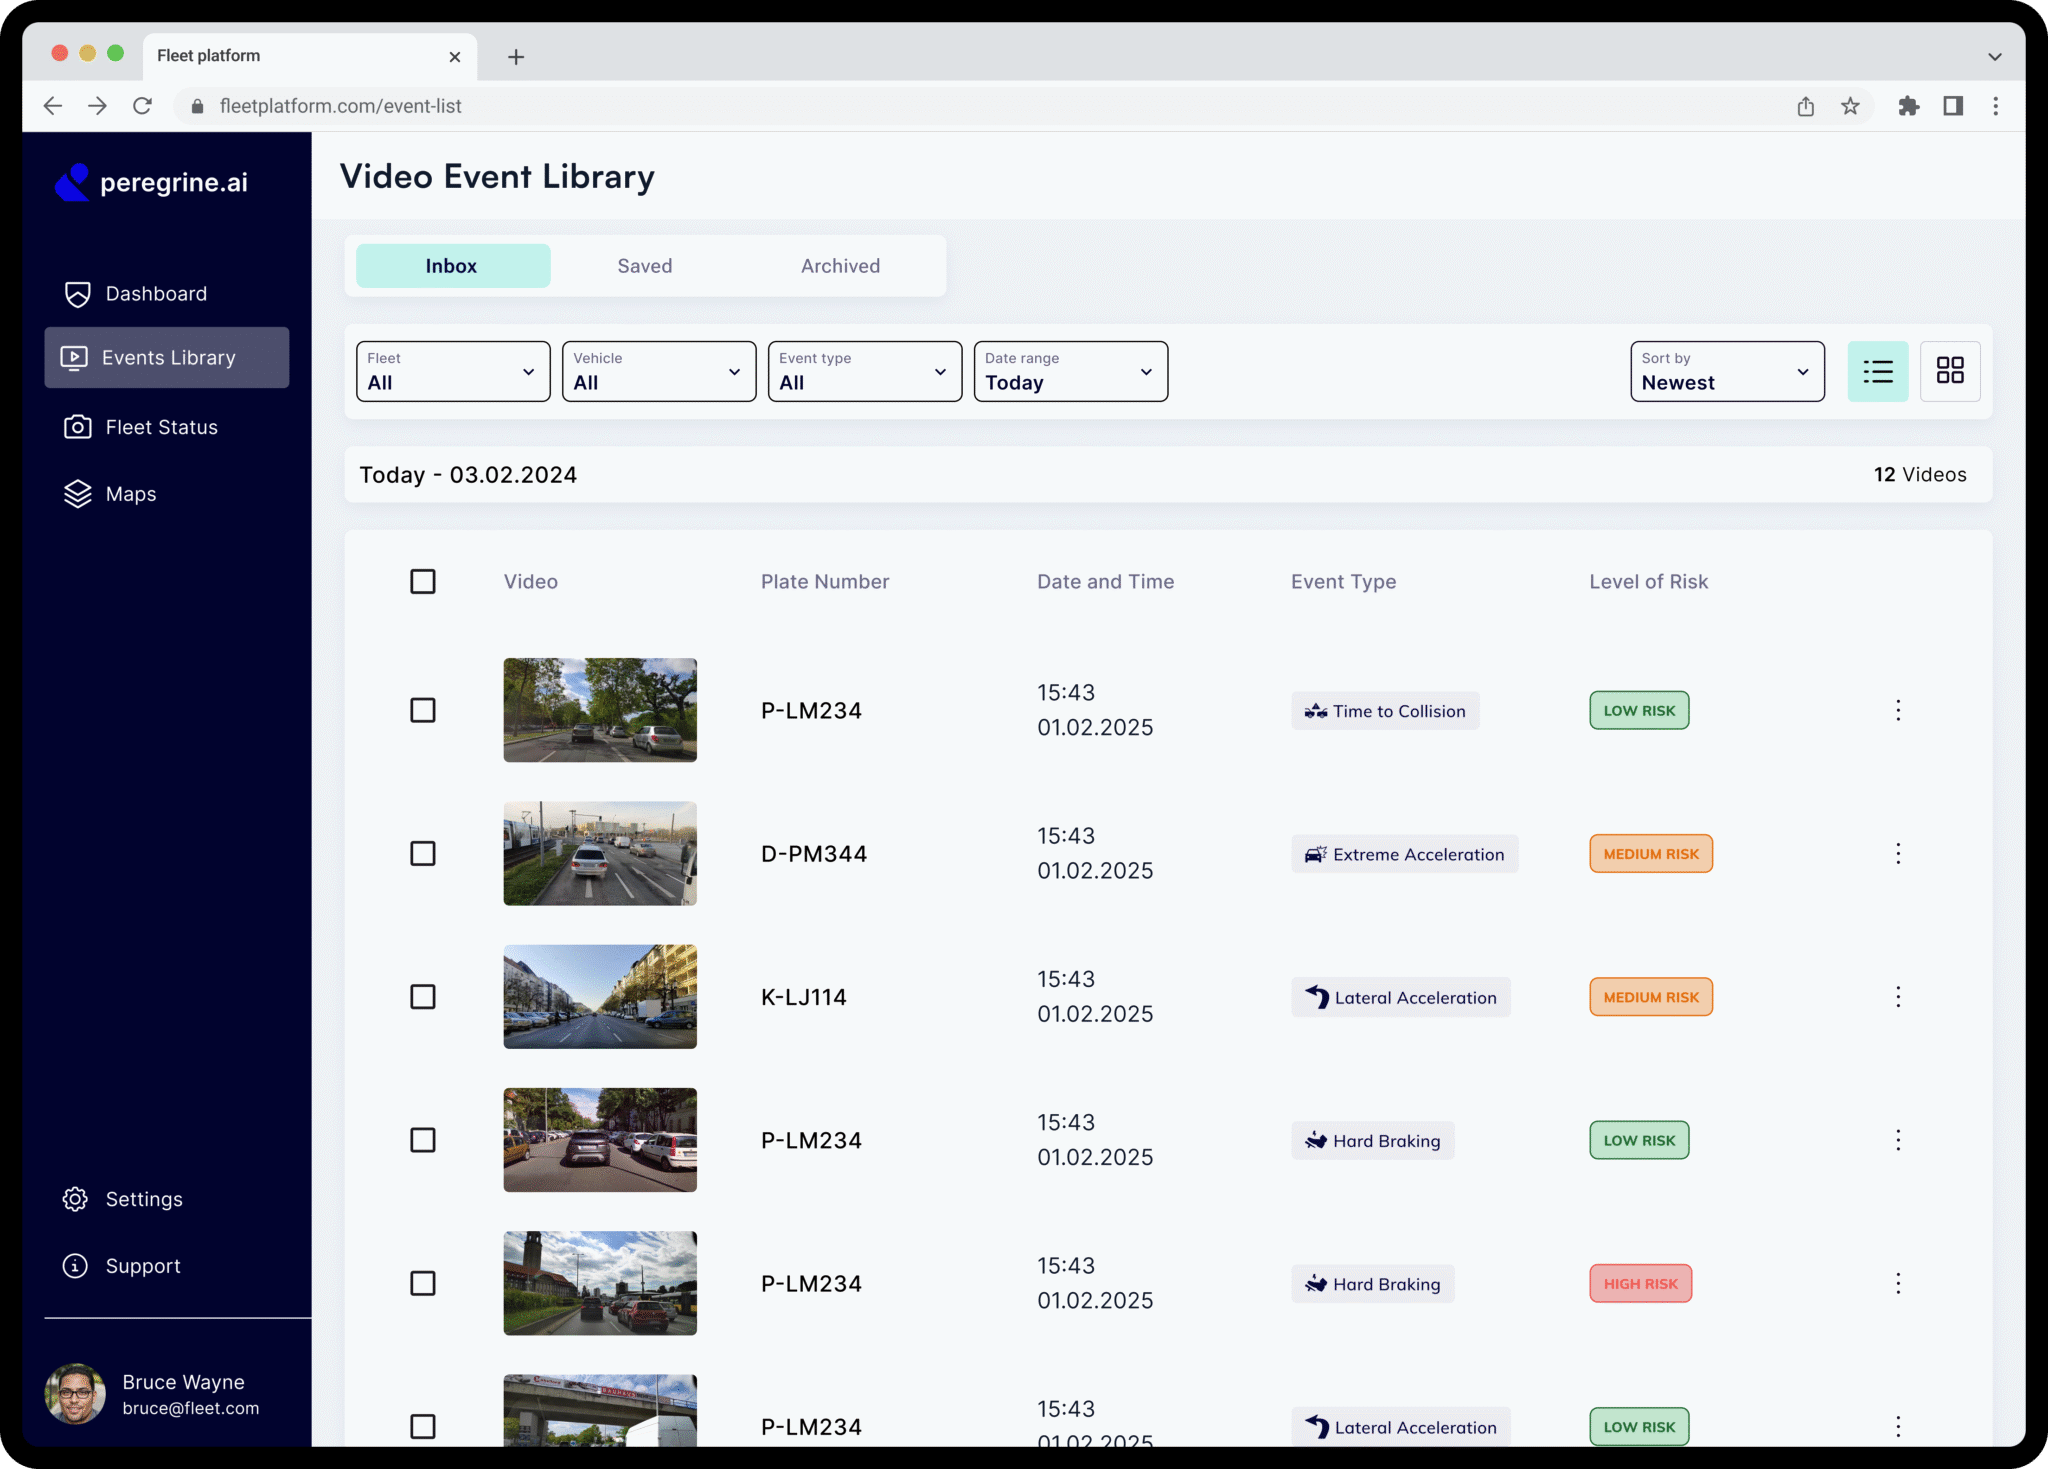
The interface for the Video Event Library in list mode.
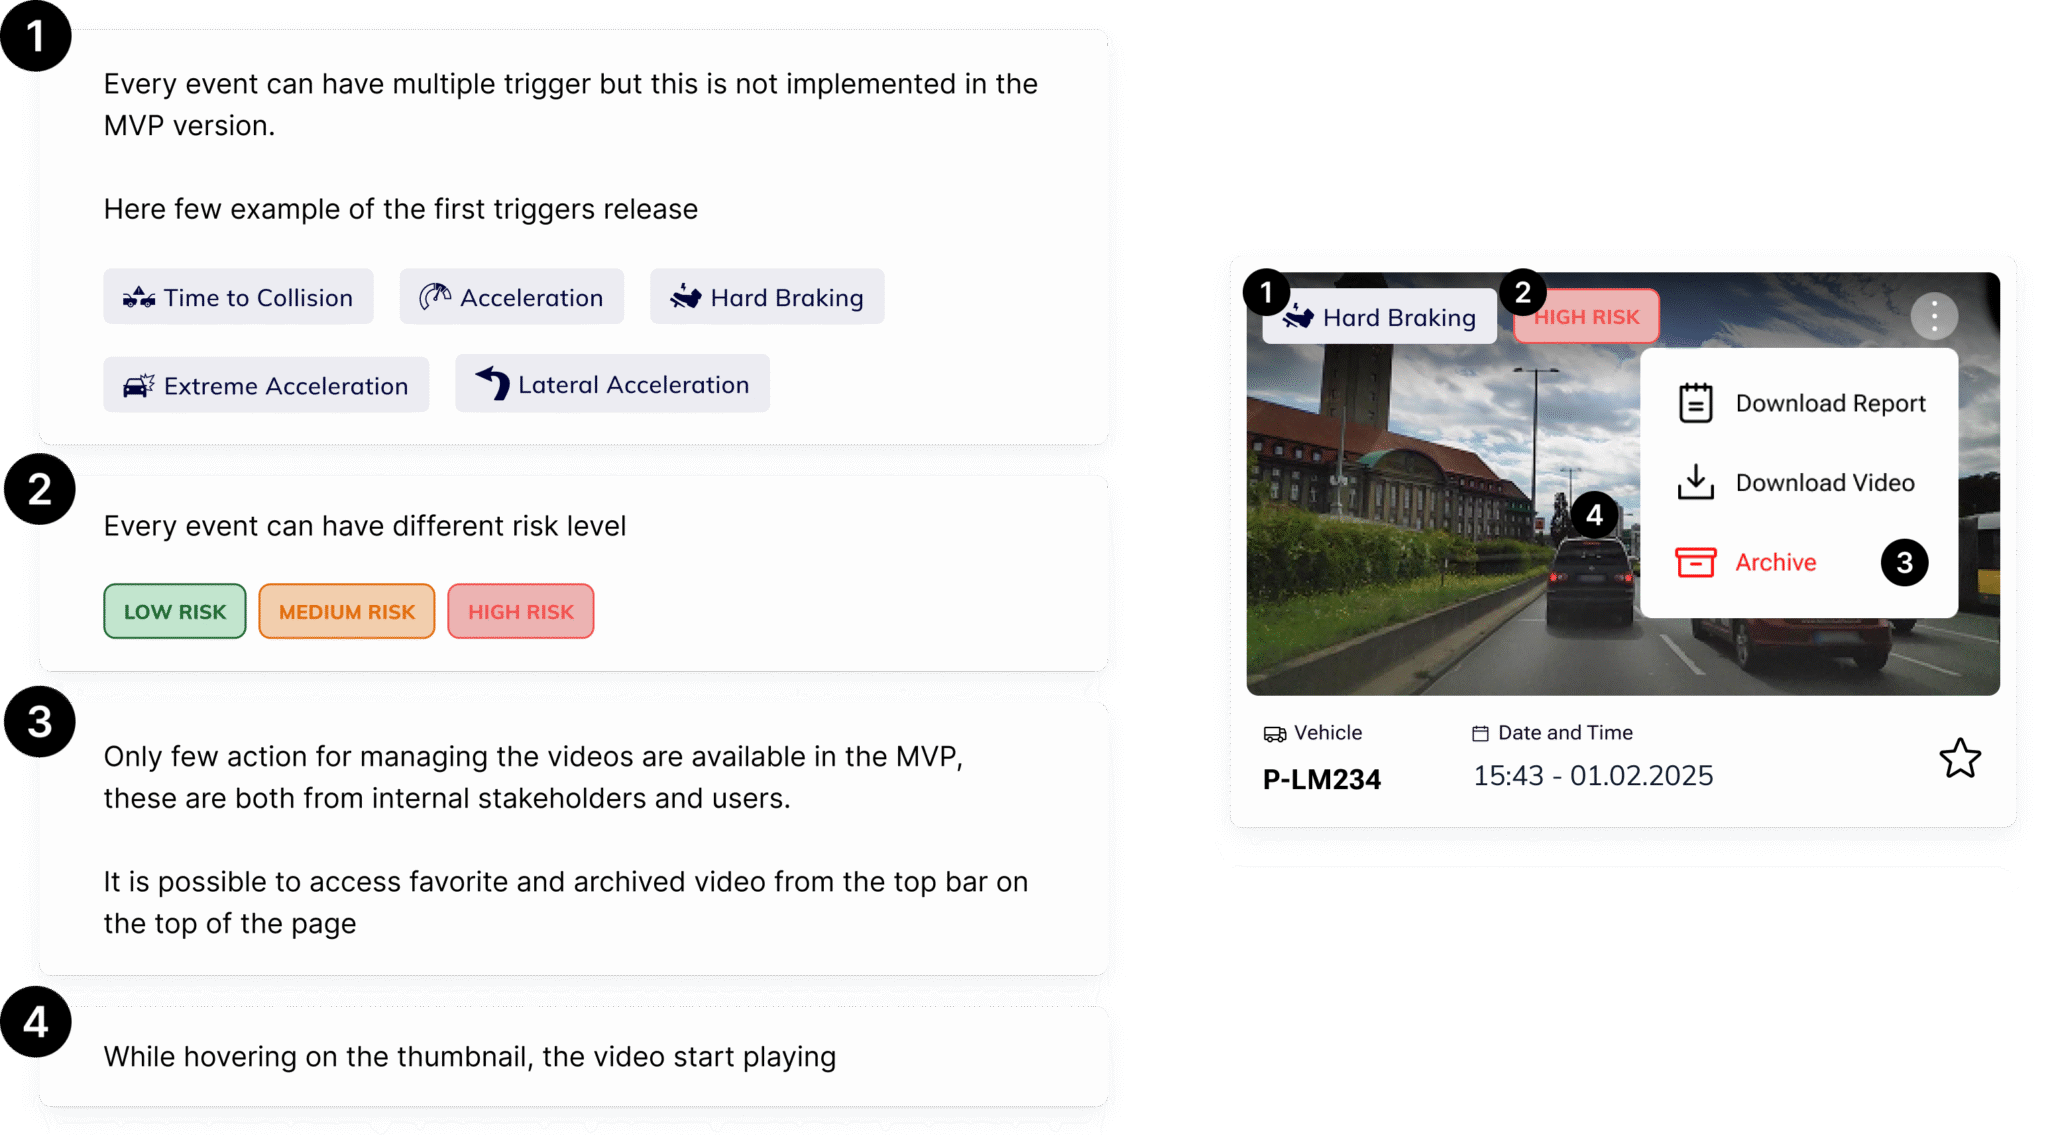
Anatomy of a Video Event card.
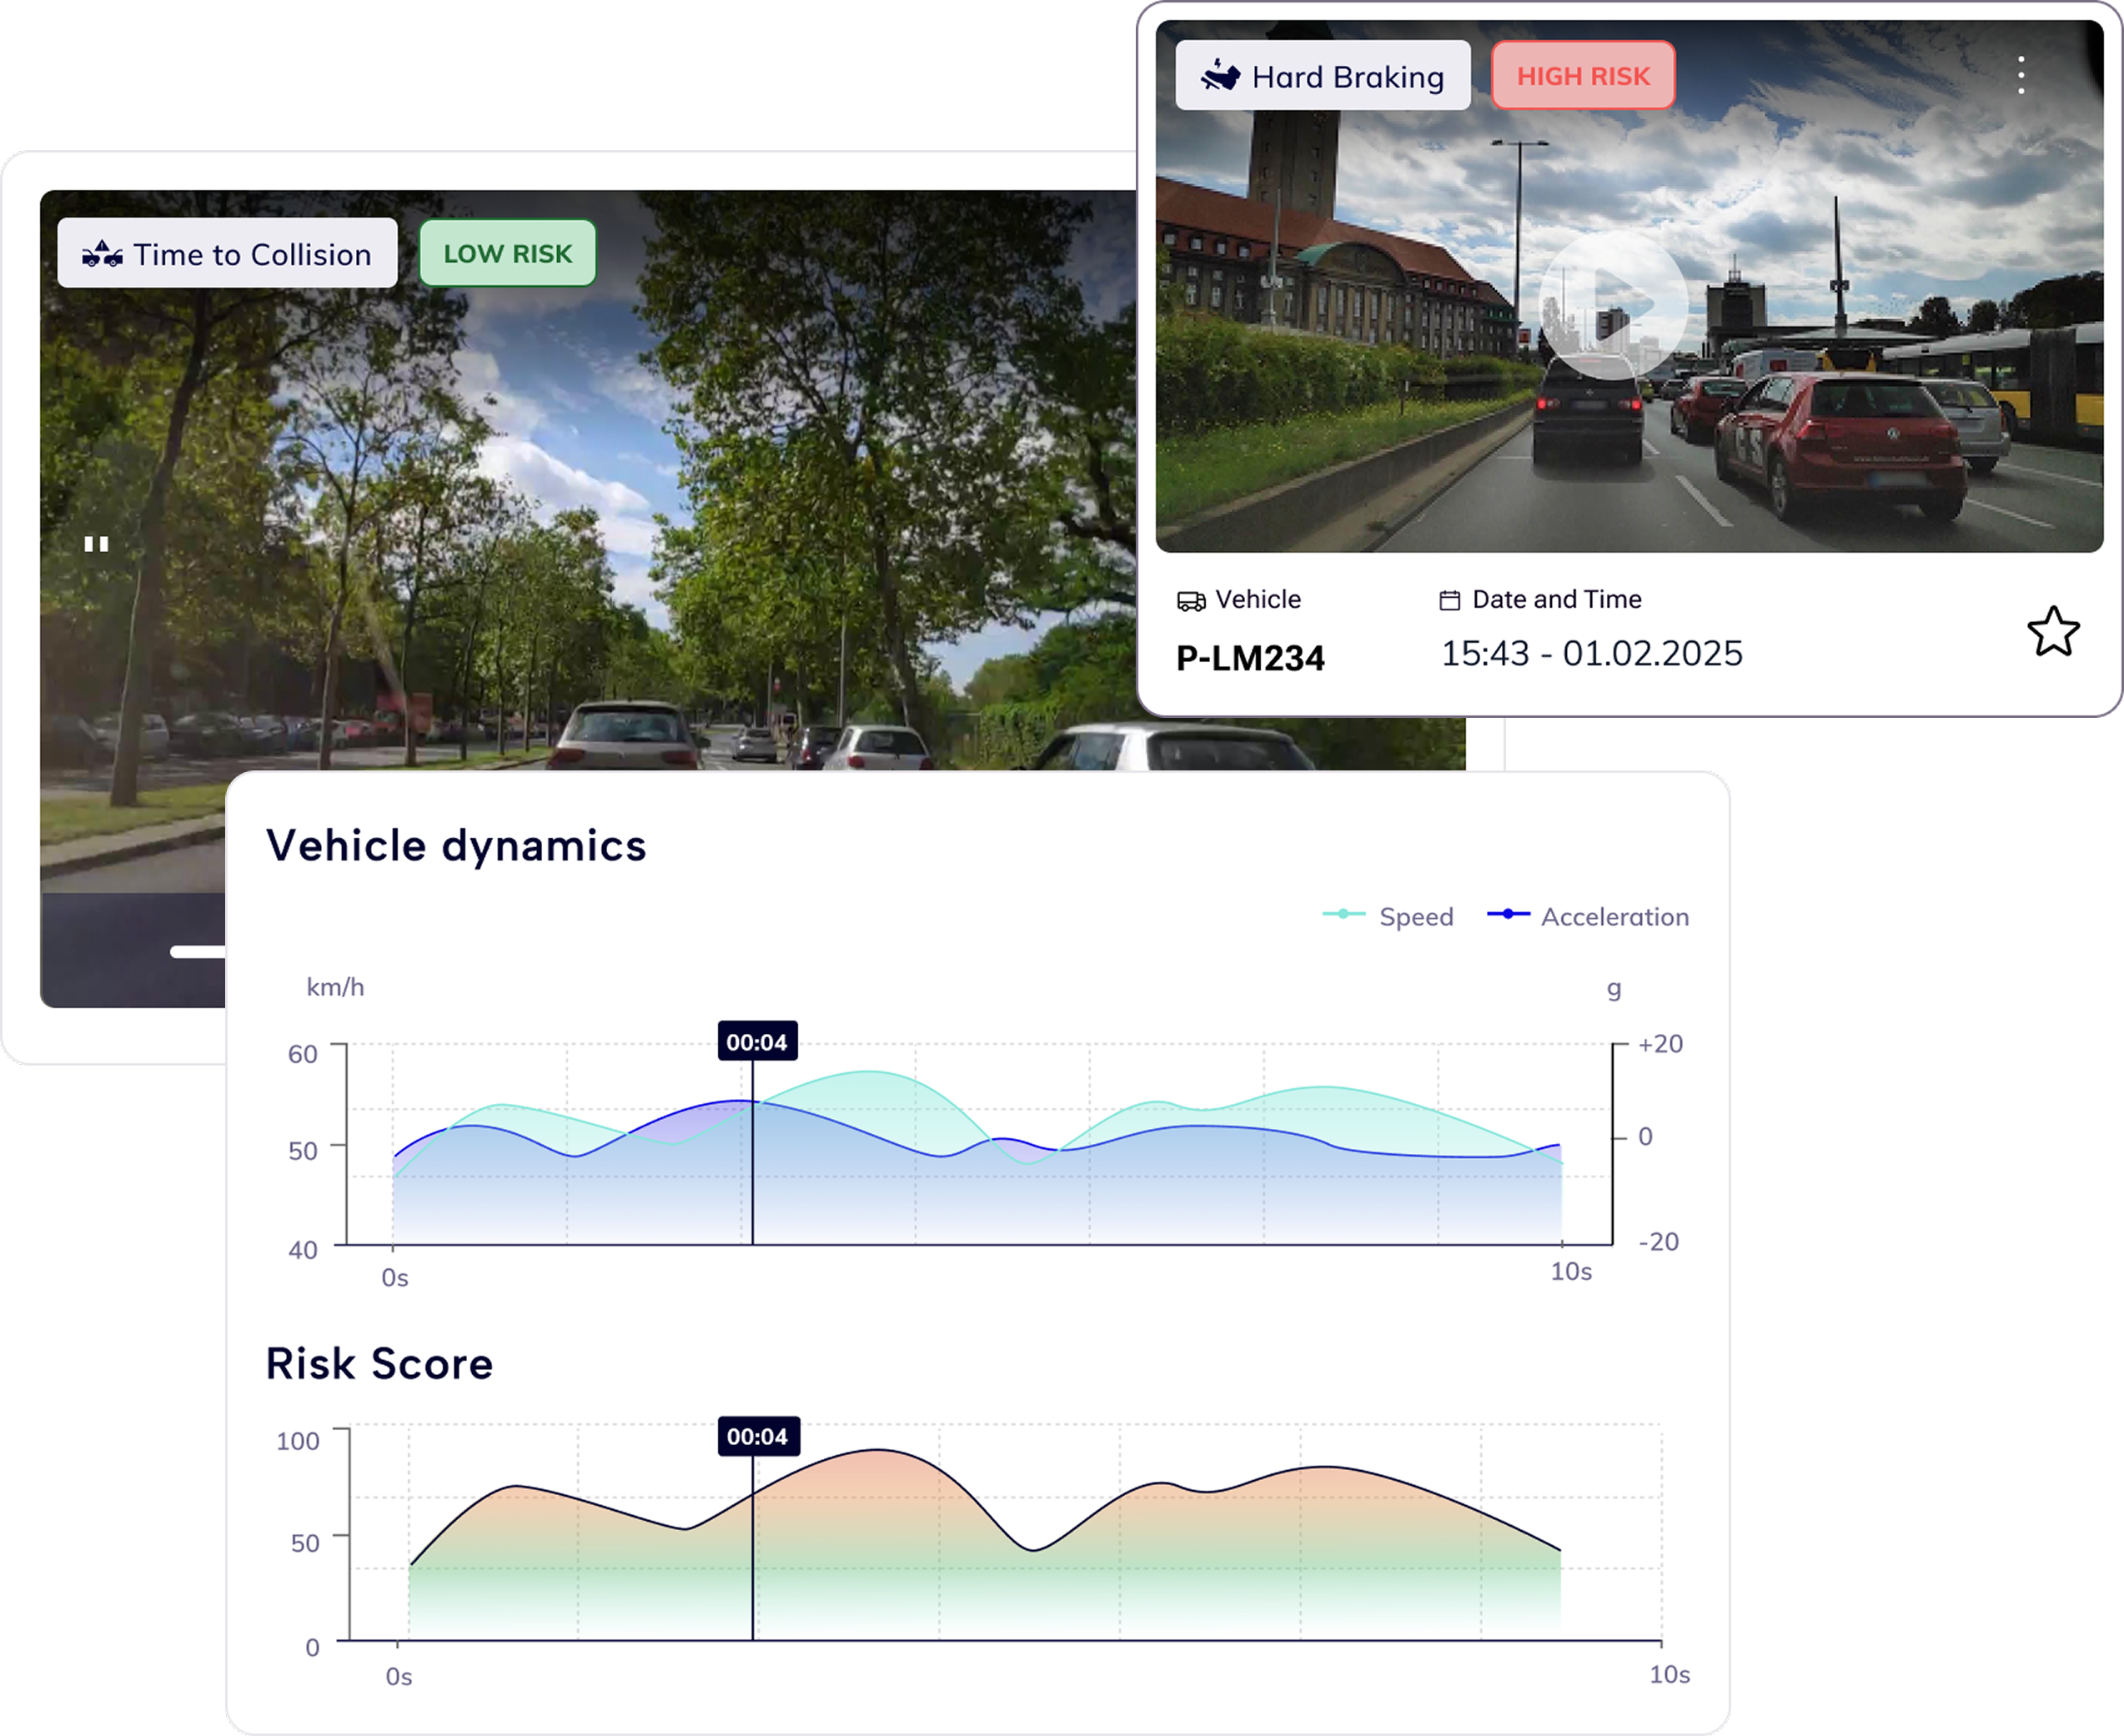
Event Detail View – Understand the “Why”
The Detailed Event View provided the crucial context needed to understand each event. Synchronized video playback with data plots (speed, acceleration, braking force) allowed fleet managers to see exactly what happened and correlate it with driver behavior. Event location on a map and relevant metadata provided further context, giving a comprehensive view of the event. This page offered deeper insights, enabling more effective driver coaching and safety improvements.
Key Features
-
20-second video clips (10s before/after trigger)
-
Synchronized data graphs (speed, braking, acceleration)
-
Interactive slider, map, and metadata for full context
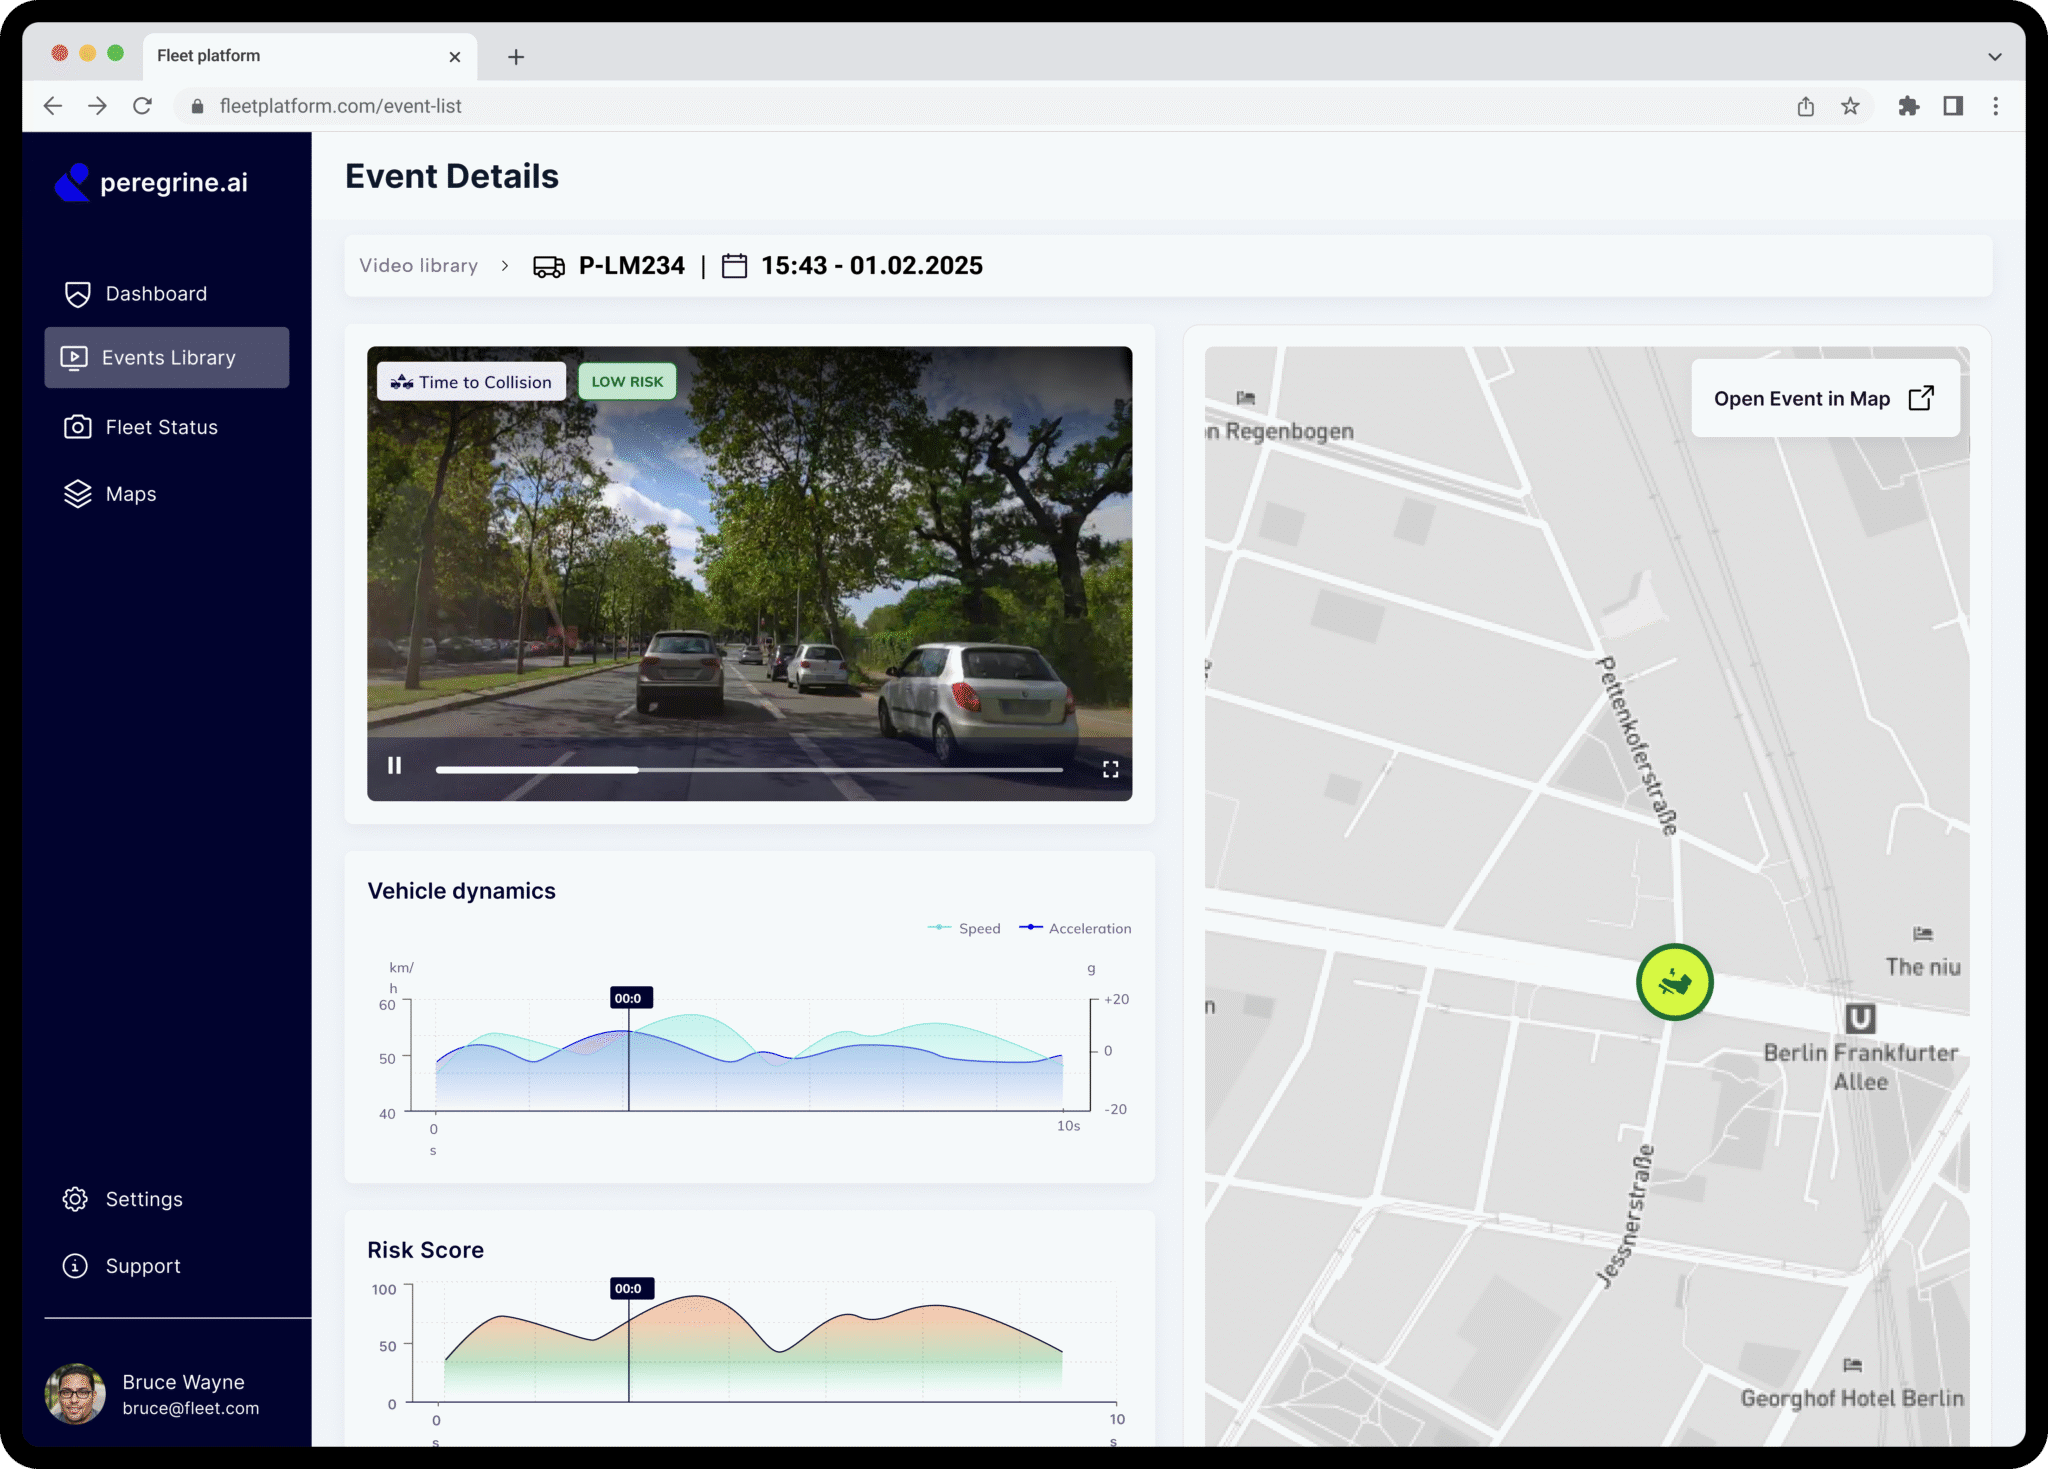
The interface of the Video Event.
"With no way to support automated alerts yet, I made filtering the hero of the interface — surfacing high-risk events fast and clearly. It was a deliberate choice: prioritize clarity and control now, while laying the groundwork for future automation."
05
NAVIGATING CONSTRAINTS
Navigating Constraints with Creativity
False Positives
Initial dashcam data suffered from frequent false positives, jeopardizing the reliability of automatic notifications.
Solution: I added a manual video management system so both internal and external users could mark irrelevant events and give more information to train Ai for future development. This improved trust and provided better training data for ML.
Solution: I added a manual video management system so both internal and external users could mark irrelevant events and give more information to train Ai for future development. This improved trust and provided better training data for ML.
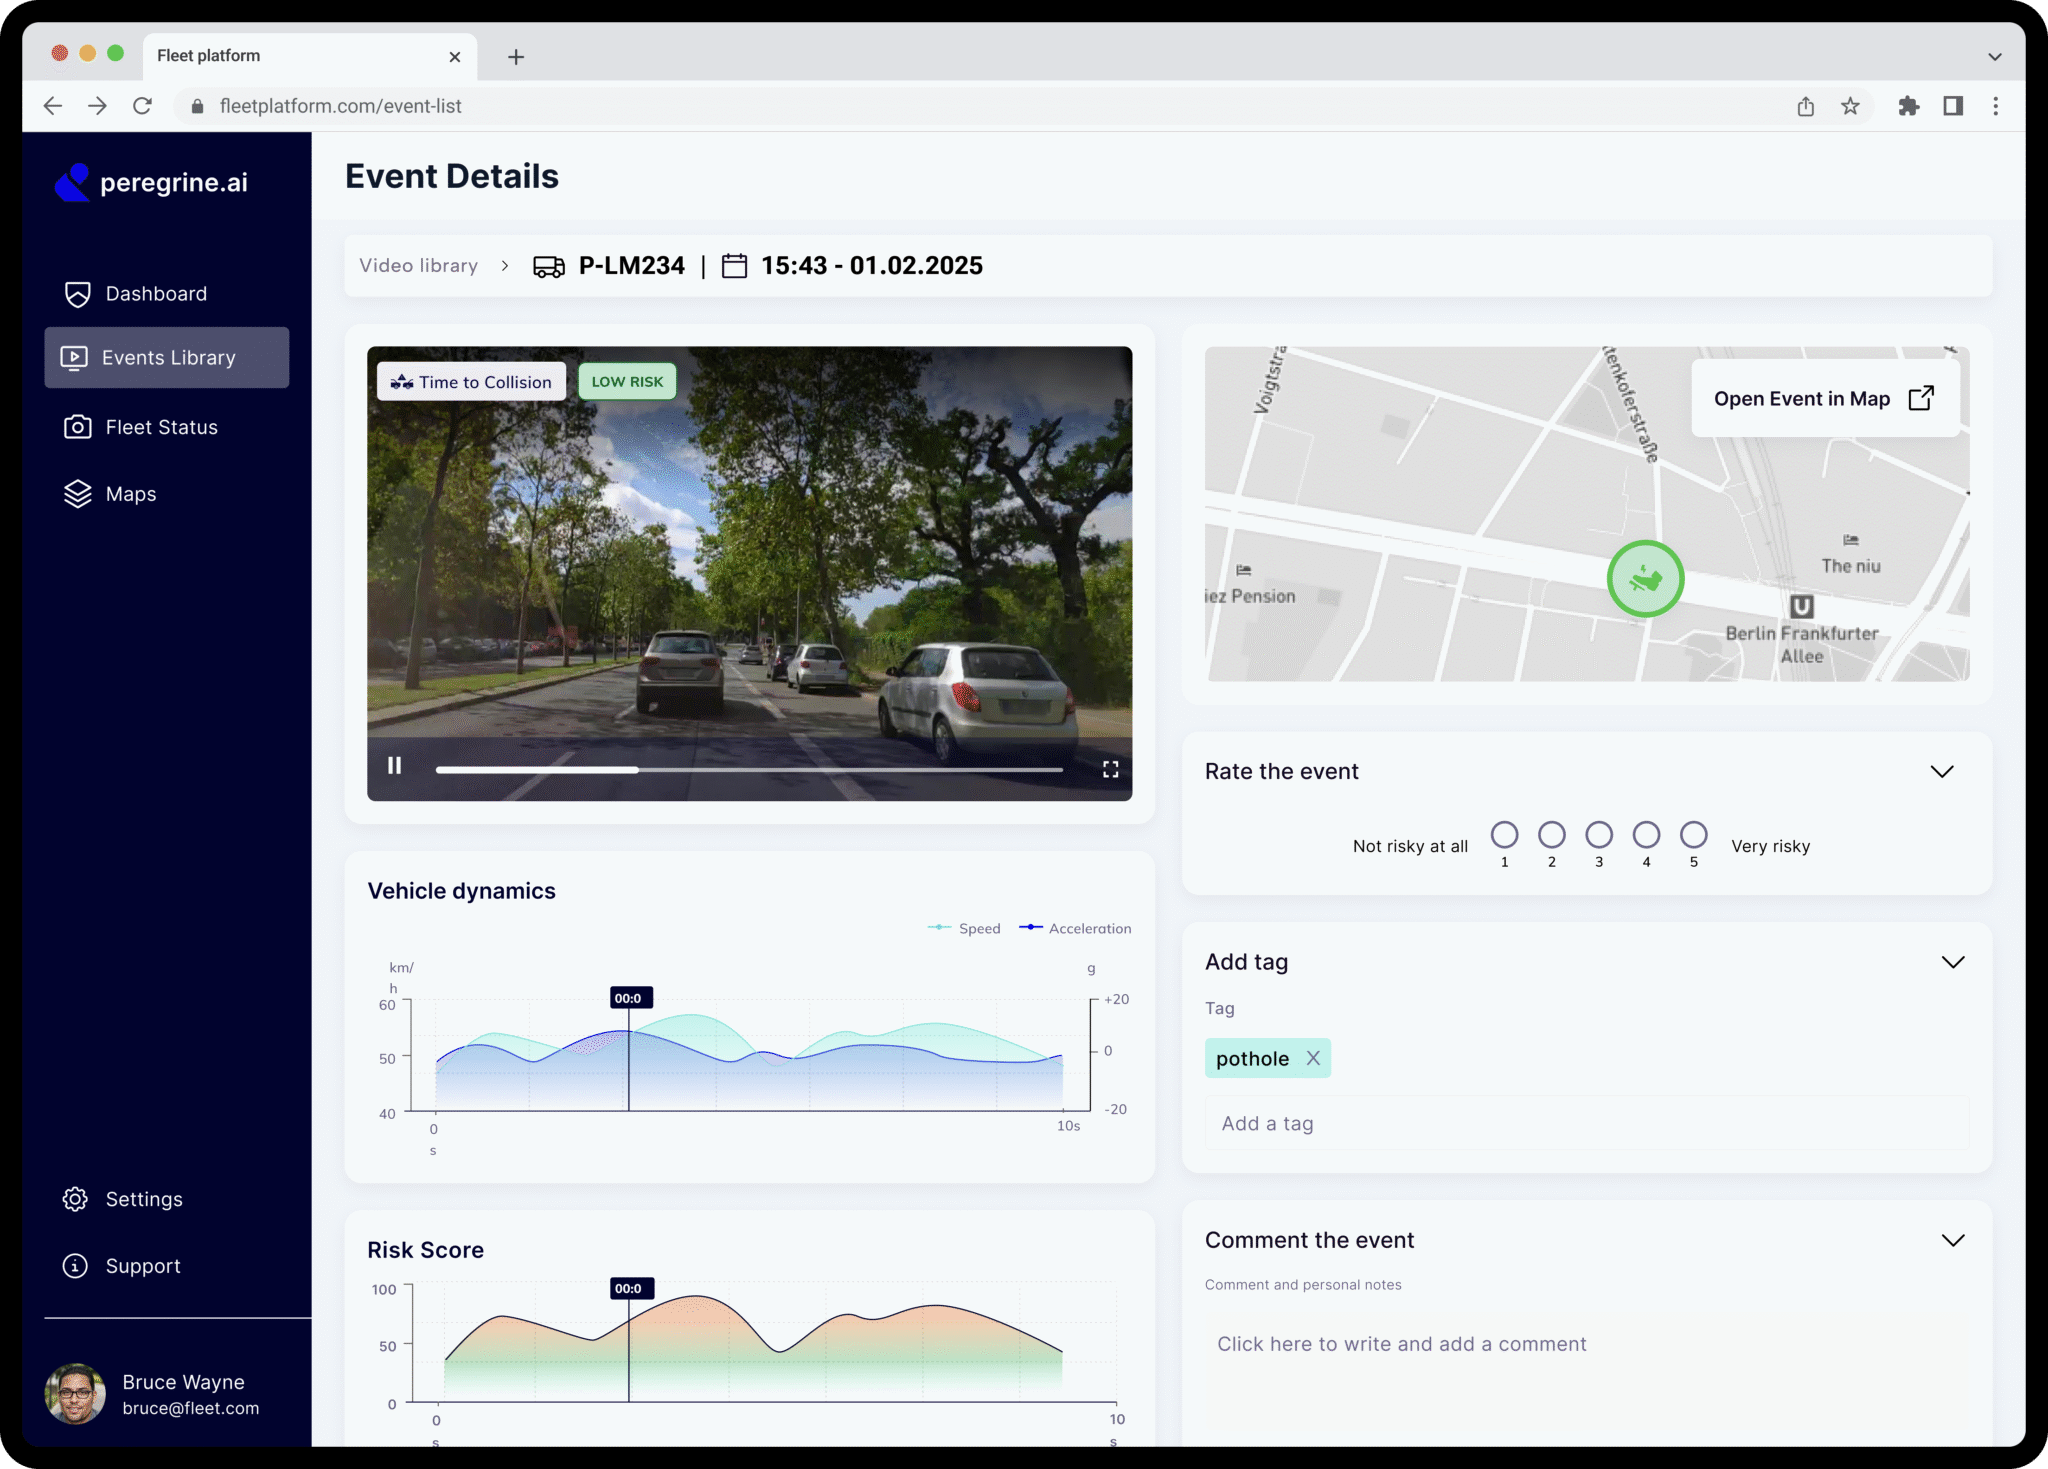
The interface of the internal stakeholder with additional ML training system for AI.
Missing Context: No automated incident explanation yet
Solution: Collaborated with the data team to deliver manually curated weekly risk reports. These acted as a “sneak peek” of future AI capabilities.
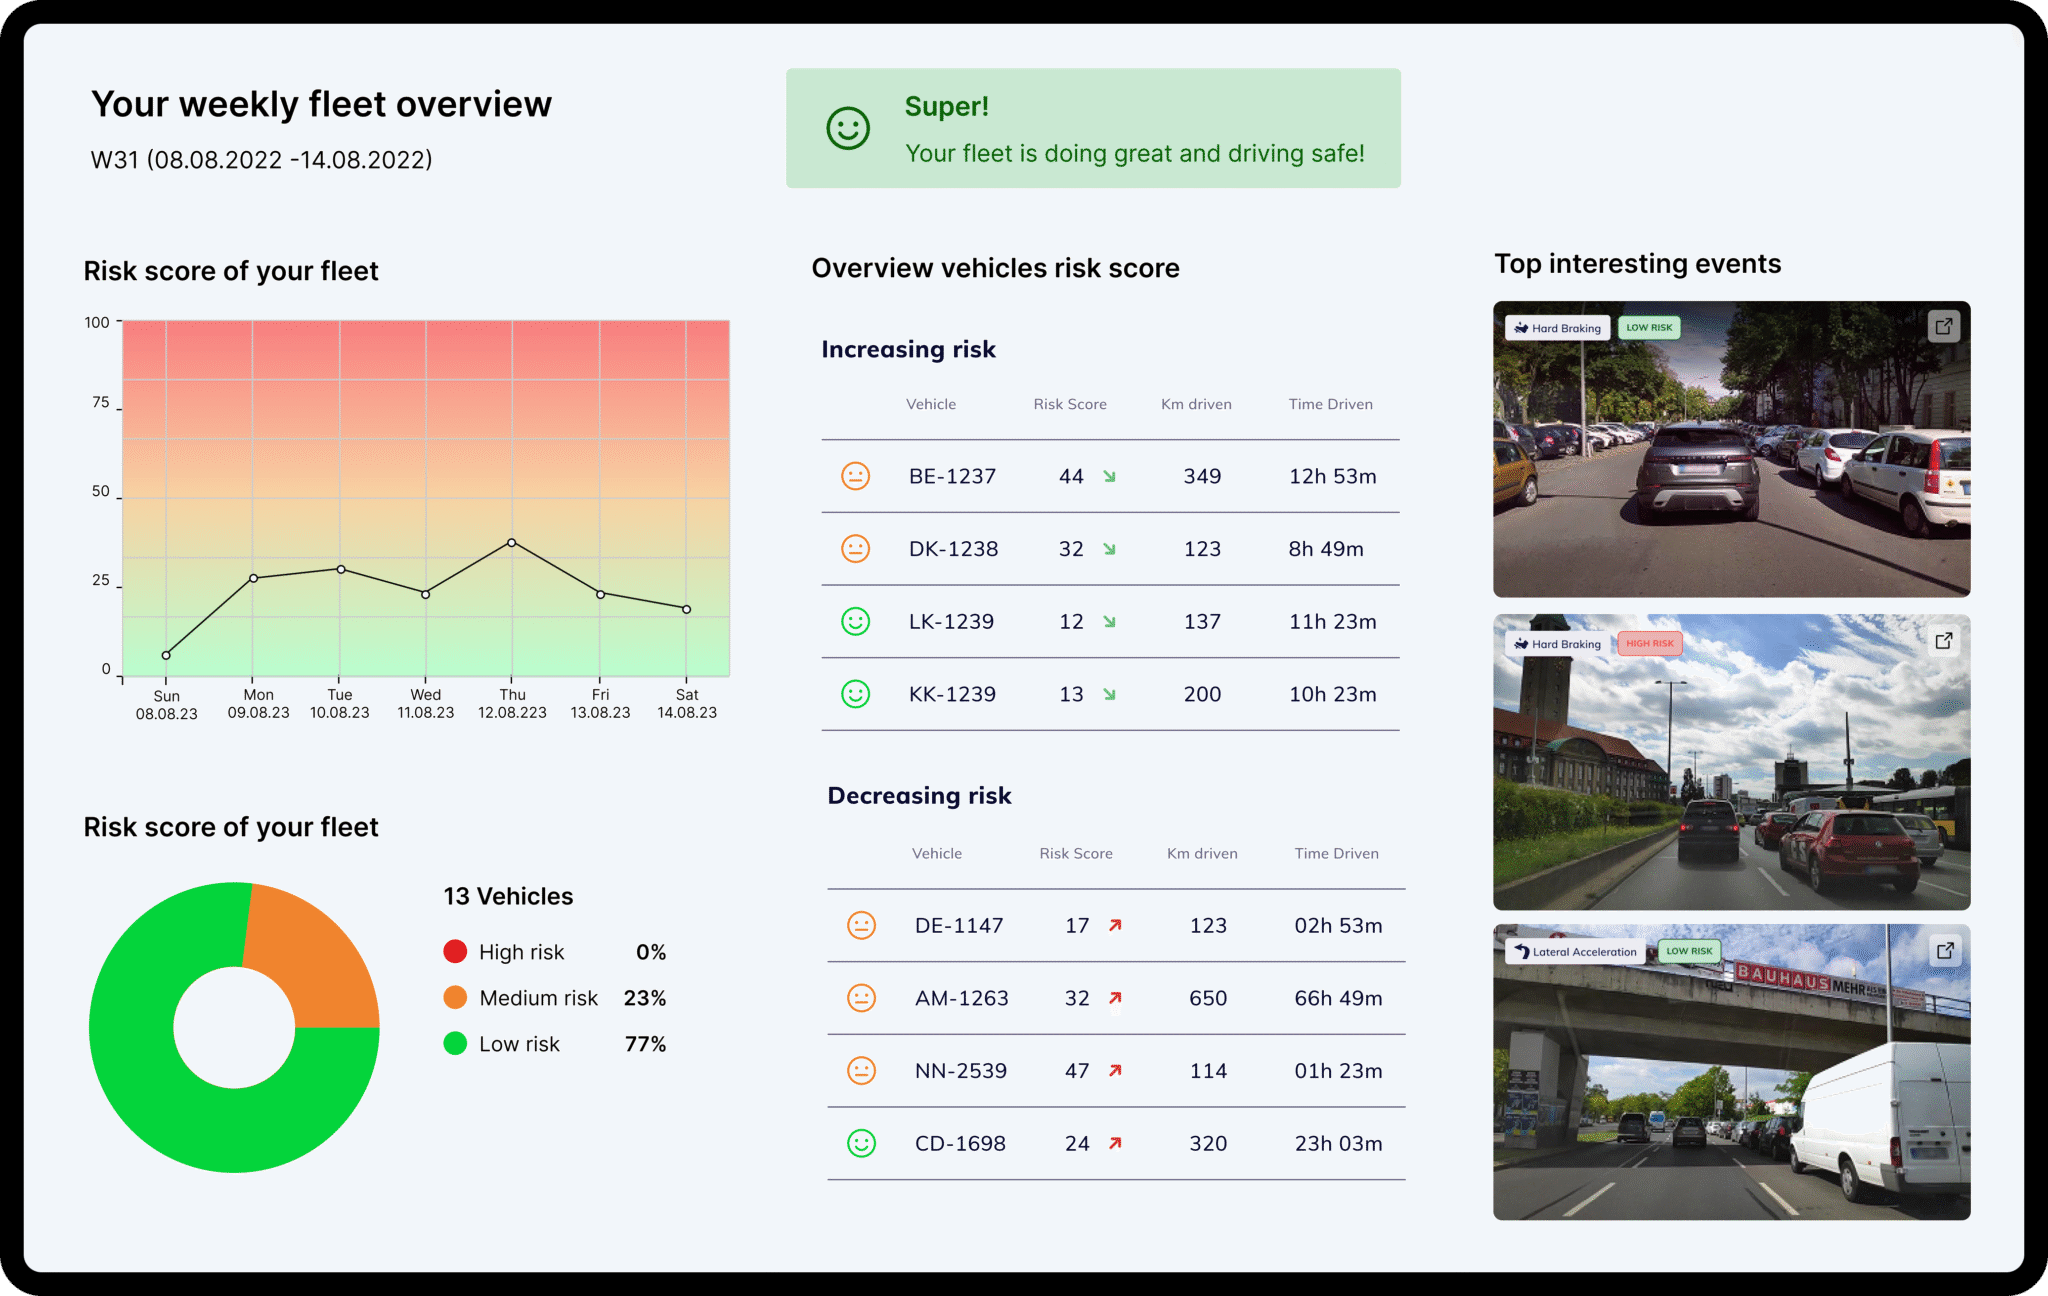
Example of report sent out to clients – became later an interactive dashboard in the product
06
IMPACT
Business Impact
The MVP wasn’t just a functioning interface — it was a proof of concept for the business. By delivering a usable, impactful product, we were able to:
-
Enable adoption with first customers and pilot fleets
- Improve AI training data through structured feedback loops
- Secure funding thanks to a usable, visual product story
-
Anchor the product vision and create internal alignment
-
Introduce UX maturity into a deeply technical environment
"The MVP streamlined accident management, improved data reliability, and gave fleet managers real, actionable insights — ultimately validating our product vision and helping secure a critical funding round."
07
NEXT STEPS
Looking Ahead
The MVP laid the groundwork for growth — both in product and organizational culture. Next priorities included:
-
Driver identification + notifications
-
Predictive risk scoring and AI analysis
-
Event benchmarking for fleet-level coaching
-
Automation of weekly risk reporting